Rev Up Your Ride: The Ultimate Guide to Peloton Power Zones
Start training with this personalized progressive method.
By Team Peloton•
What Are Peloton Power Zones?
What Are the Different Power Zones?
How Are Peloton Power Zones Calculated?
What Are Peloton Power Zone Classes Like?
Why Peloton Instructors Love Power Zones
Adding Peloton Power Zone Training to Your Routine
The Benefits of Power Zone Training Training—Beyond the Bike
Why Members Love Peloton Power Zones
Get Started with Peloton Power Zones
If Peloton Power Zones are a mystery to you, you’ve come to the right place. Led by our expert instructors Matt Wilpers, Christine D’Ercole, Denis Morton, Olivia Amato, Ben Alldis, Sam Yo, Erik Jager, Tunde Oyeneyin, Christian Vande Velde, Charlotte Weidenbach, and Hannah Frankson, Power Zone Rides are focused on achieving specific output levels at different times throughout a class in order to improve your strength, endurance and overall performance. Translation: They’re one of the most effective ways to level up your fitness when it comes to indoor cycling, because the program is customized to you and your capabilities.
Ready to level up your training? Here’s everything to know about Peloton Power Zones and how to add power zone training to your Bike workouts.
What Are Peloton Power Zones?
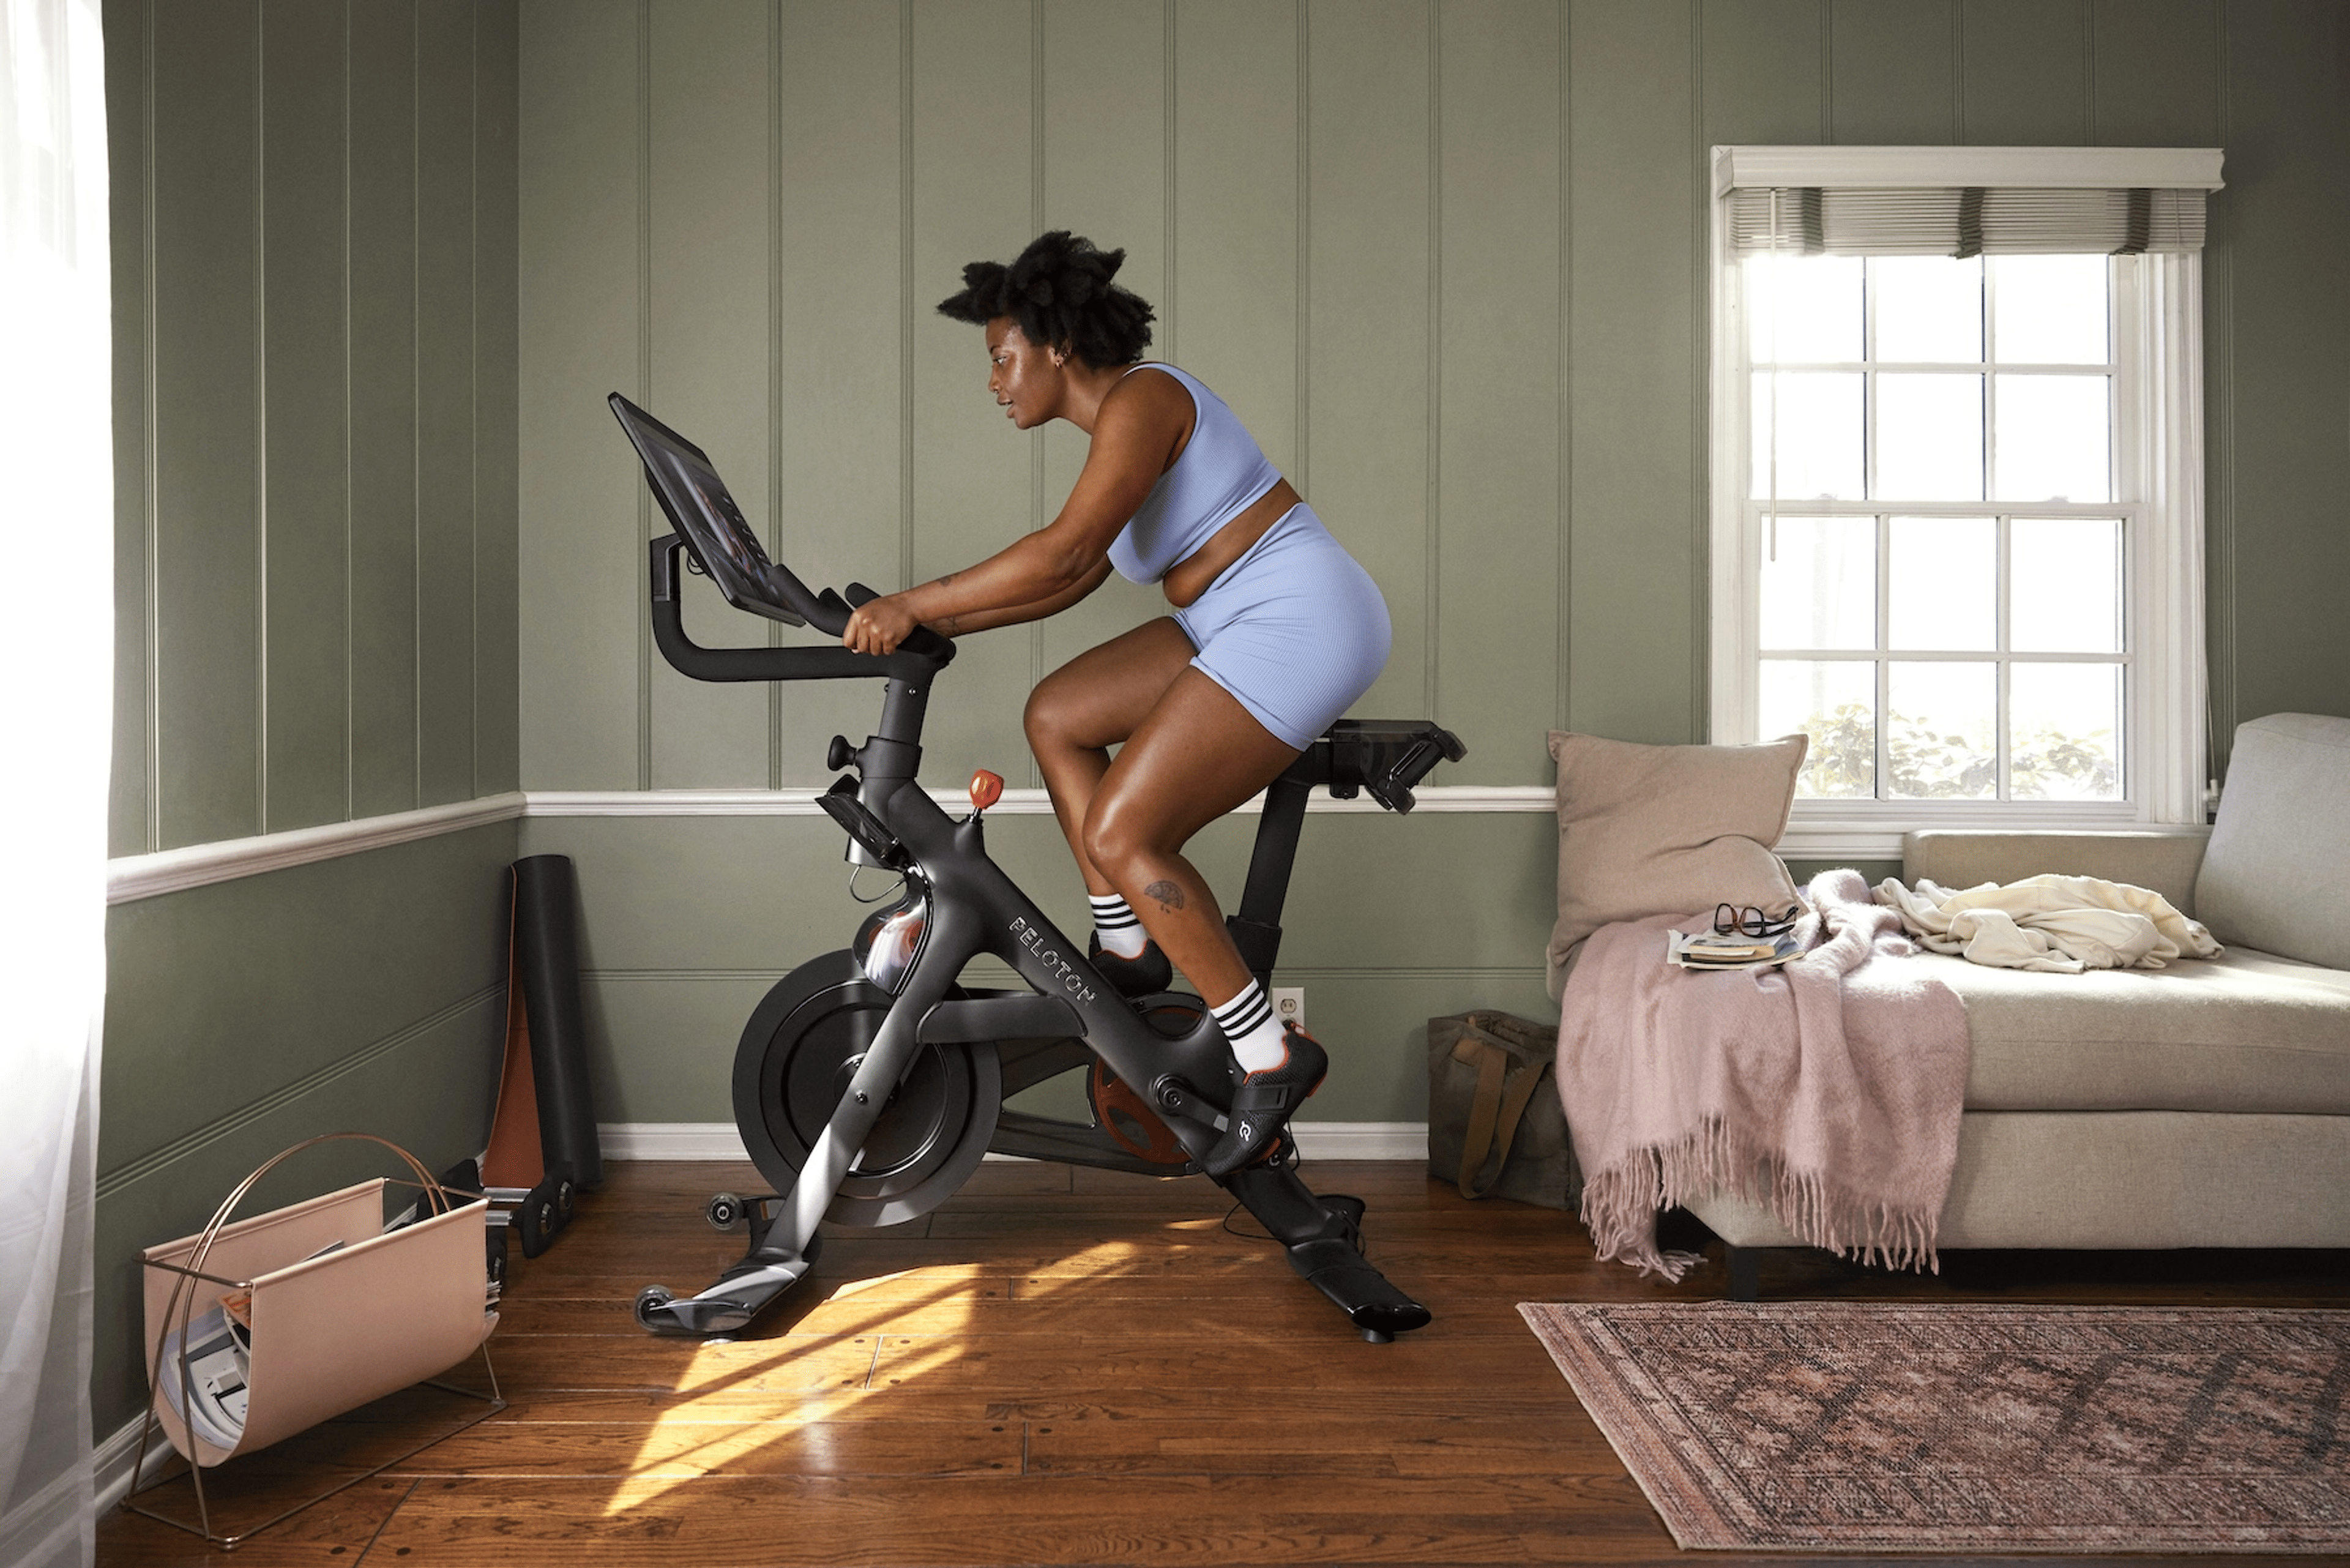
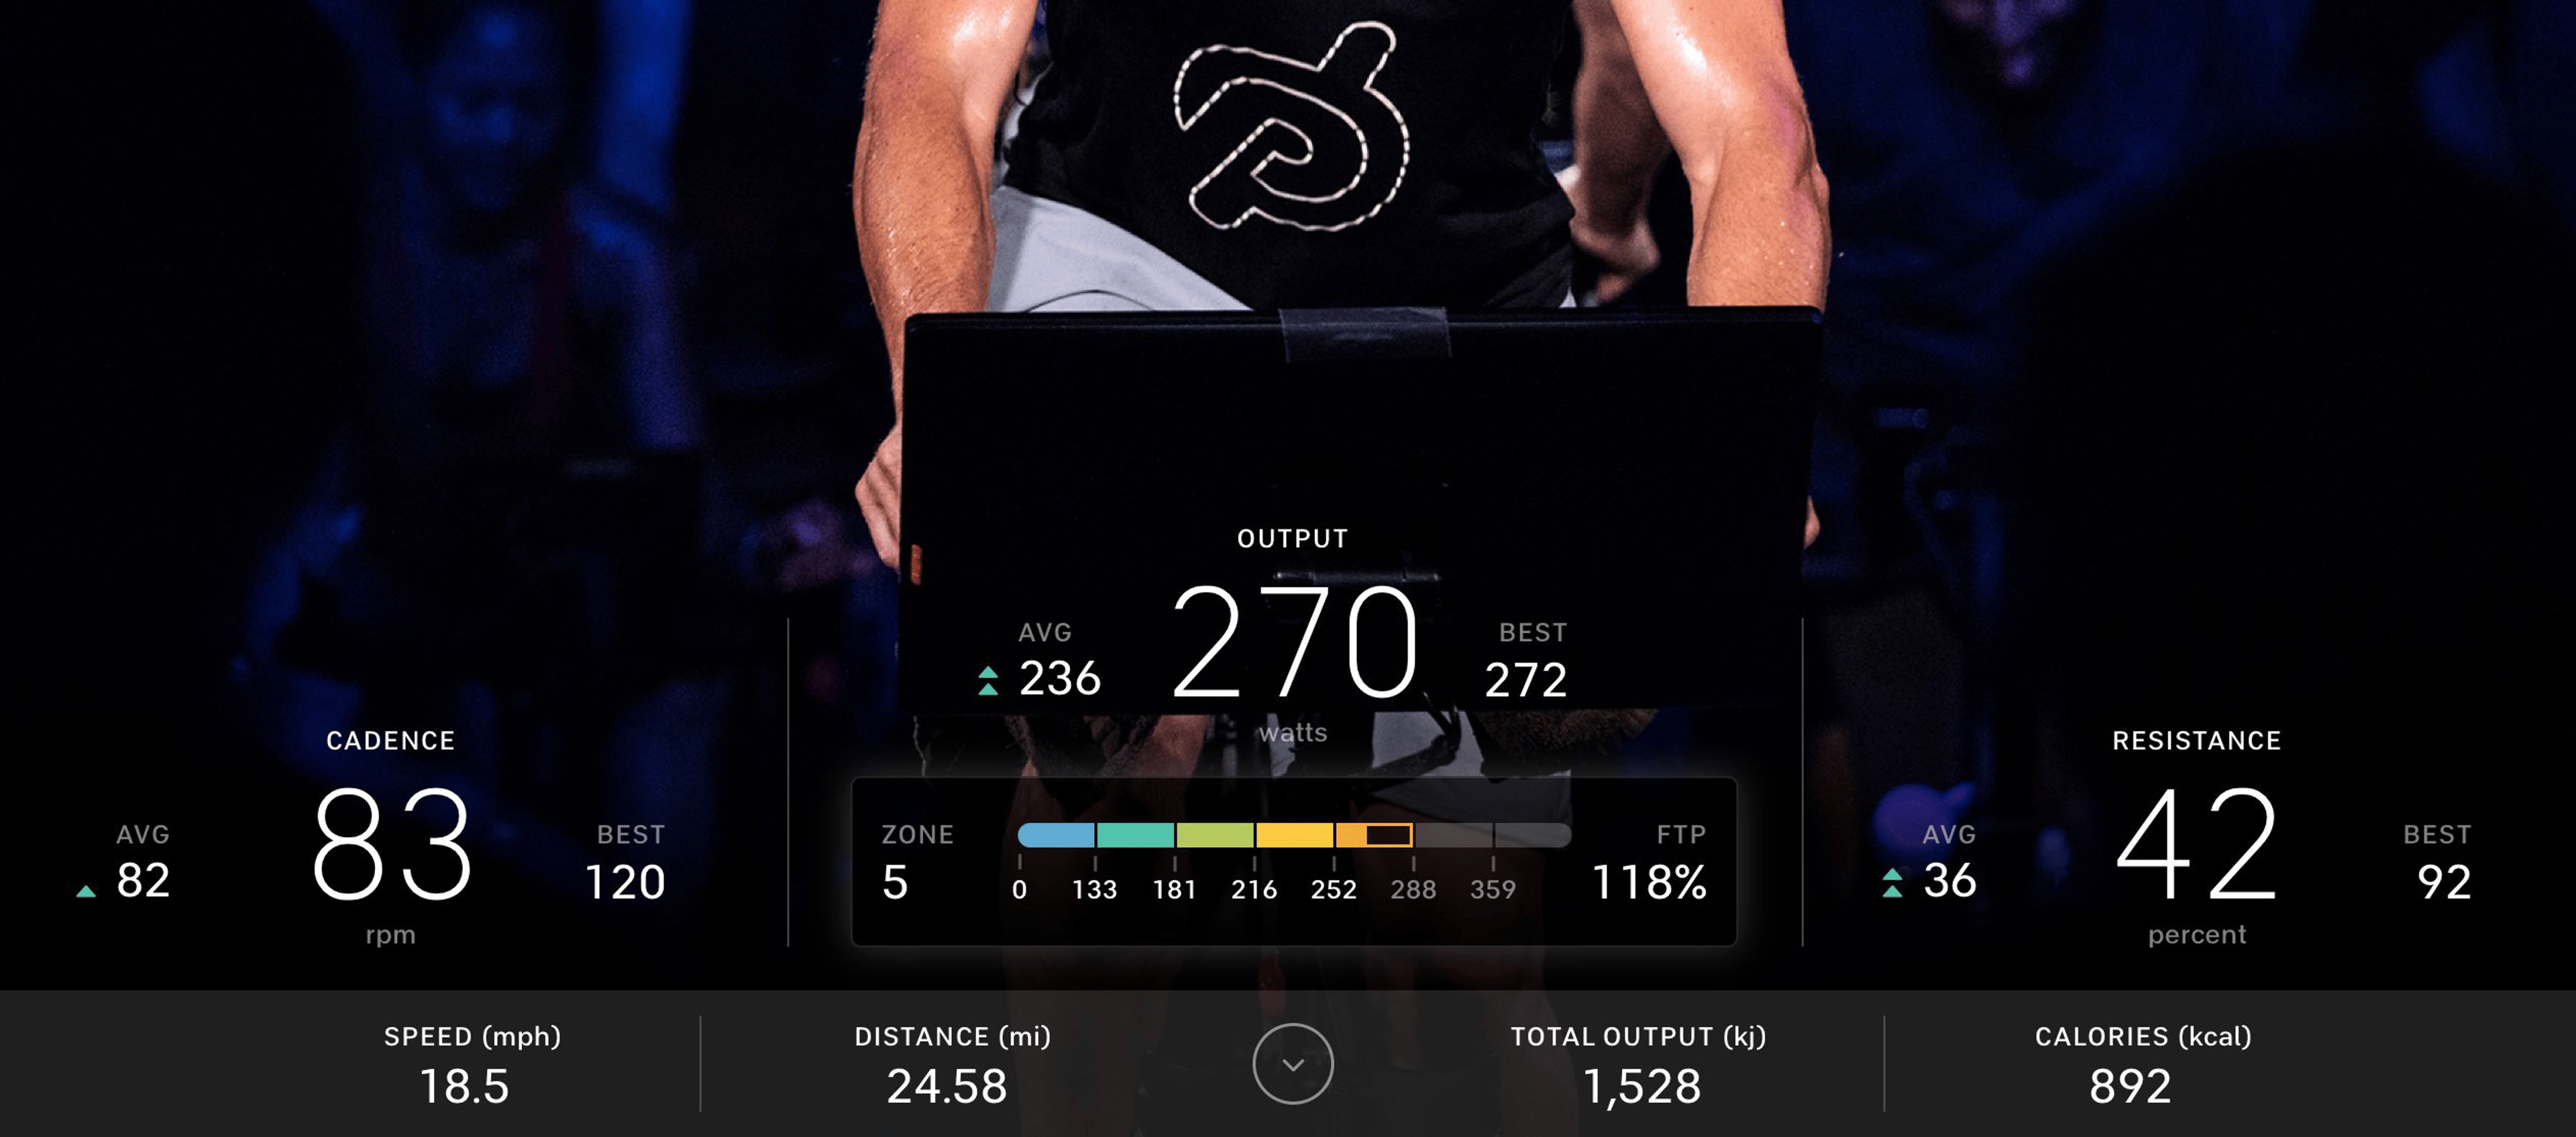
Peloton Power Zones are output ranges—that is, they’re a measurement of how hard you’re working at any given point during a ride, measured in watts and calculated by a combination of cadence (speed) and resistance (how heavy the flywheel feels). There are seven power zones, with each zone representing a target output range. These output ranges are customized for each rider, so your zone 4 may be another rider’s zone 2 (more on that later).
During a Power Zone Ride, your instructor will cue a specific zone, which will direct you to hit the corresponding output range on your Bike by adjusting your cadence or resistance. The harder you pedal, the more your output increases, allowing you to advance to a higher power zone. On the other hand, you’ll recover from tough efforts in a lower power zone by lowering resistance and slowing your legs.
By using these customized output zones as a guide, you will be able to see and feel yourself improve as each zone becomes easier to achieve over time.
What Are the Different Power Zones?
Your Functional Threshold Power, or FTP, is key to power zone training. FTP is the highest power a rider can maintain for one hour on a bike. Your personal power zones are a percentage of that FTP, and as mentioned, may be different from other riders.
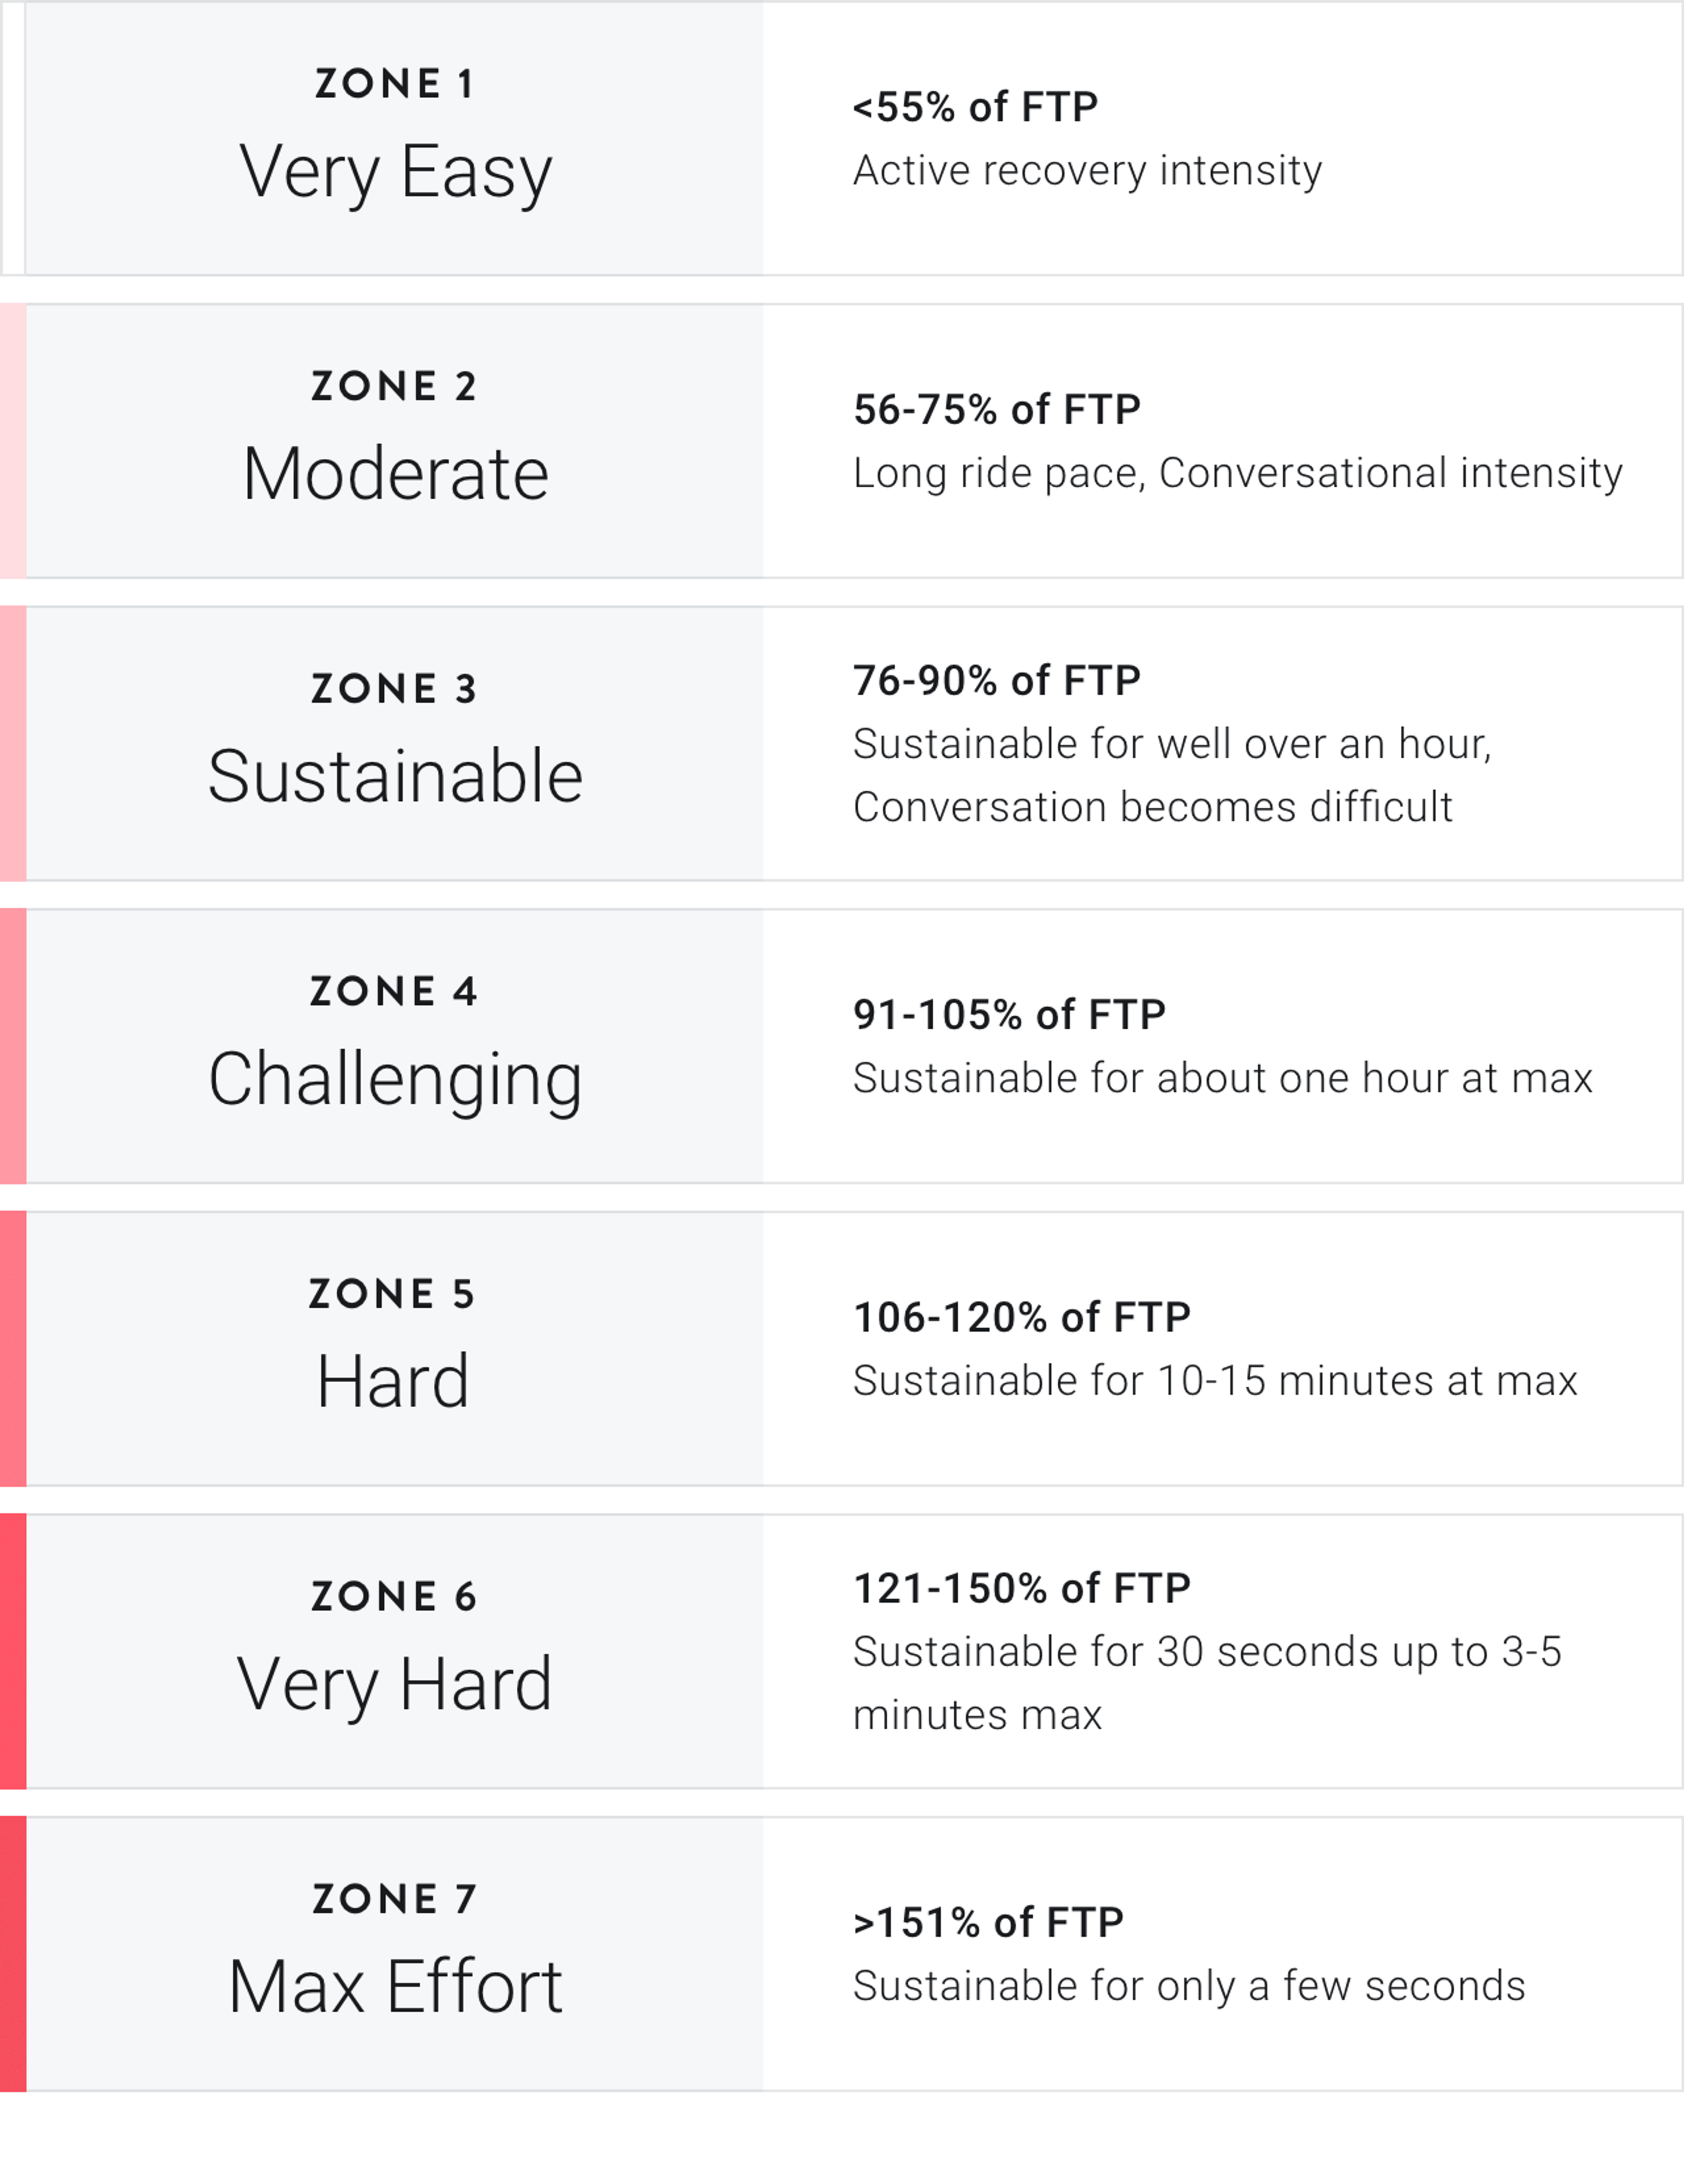
Zone 1: Easy (<55 percent of FTP)
An easy cycling speed with little resistance and pedal pressure, this zone requires little mental and physical effort to keep up your pace. As you pedal, you should be able to hold a conversation. It’s often considered an active recovery zone, and you’ll typically find yourself in zone 1 between interval efforts or on recovery rides.
Zone 2: Moderate (56-75 percent of FTP)
This zone is also an easy effort pace that you can hold for long distances, which is why it’s also called the endurance zone. You should still be able to hold a conversation while cycling in this zone, but unlike zone 1, you may need greater focus to maintain the pace.
Zone 3: Sustainable (76-90 percent of FTP)
You can probably still hold a conversation with your fellow riders when you enter this zone, but it will require a little more concentration to stay on pace, plus you'll put in slightly more physical effort. You should be able to keep cycling in this zone for an hour, but it will be more challenging than the easy, hour-long rides you do in zones 1 and 2.
Zone 4: Challenging (91-105 percent of FTP)
If you stay in zone 4 for an hour, you’ll likely need to tap out as soon as the 60 minutes is up. You’ll start to experience moderate fatigue in your legs as you pedal through this zone, and talking will become increasingly difficult as your respiratory rate increases. This zone is sometimes called the “Sweet Spot Zone,” as it requires aerobic fitness and muscular endurance to maintain, but it shouldn’t be so difficult that you quickly run out of steam.
Zone 5: Hard (106-120 percent of FTP)
Looking to increase your VO2 max? You’ll want to spend some time in zone 5. By this point, your breathing is probably a bit ragged, and you’ll definitely feel the burn in your legs. While intense, this zone is particularly beneficial for aerobic and anaerobic fitness.
Zone 6: Very Hard (121-150 percent of FTP)
Fans of intervals will be familiar with this zone, which is hard to sustain for more than a few minutes. The strain and fatigue on the legs is high. And forget about talking—your respiratory rate will be fairly rapid within a minute of entering zone 6.
Zone 7: Max Effort (>151 percent of FTP)
Primarily used for short sprints and standing starts, the highest power zone is reserved for all-out, max efforts. This zone is meant for quick bursts, not sustained pedaling, and you’ll probably fatigue within a few seconds of pushing into zone 7.
How Are Peloton Power Zones Calculated?
With Peloton, you'll identify your FTP via your average output over a 20-minute maximum effort test (which you can find by filtering Cycling classes for Power Zone class type that are 20 minutes in length). It may only be 20 minutes, but it’s one of the toughest rides you’ll do, and it offers an accurate picture of your fitness at any given point in time.
Pro tip: Don’t skip the FTP Warmup Ride, which will give you information on the test, warm you up, and help you figure out what output level to start the test at.

Peloton Bikes
Two bikes. One Peloton experience.
Once you’ve taken the FTP test, the Bike will automatically calculate your output zones—no math required on your part. Haven’t taken the FTP test but still want to try a Power Zone class? No problem. The instructor will guide you through what each Peloton Power Zone should feel like, so you can base your effort on rate of perceived exertion (or RPE) or the talk test.
And heads up: As you continue your power zone training, you’ll probably notice that higher outputs feel easier to achieve. Feel free to retake the 20-Min FTP Test Ride at that point (or if you’ve felt your rides have gotten markedly harder) to see if your average output has changed. If it has, your new FTP score will automatically adjust your personal power zone ranges so that you can keep challenging yourself.
We recommend retesting every 4 to 6 weeks, or anytime you feel your zones are no longer appropriate for your fitness level.


What Are Peloton Power Zone Classes Like?
Wondering what you’re getting into with Peloton Power Zone classes? Here’s how they work.
In any Power Zone class, you’ll start with a warm-up that’s longer than your non-Power Zone warm-ups (typically, 10 to 12 minutes). The warm-up will include spin-ups (quick accelerations) and will finish with a build (a steady increase in output).
There are a few different types of Power Zones Rides, each serving a different purpose.
Power Zone Beginner rides are perfect if you’re new to cycling in general, or have never taken a Power Zone class before.
Regular Power Zone rides are challenging but steady. They tend to include intervals in Zones 3 through 5, with recoveries in Zone 1.
Power Zone Endurance rides require you to hold longer periods at lower outputs—only Zones 2 and 3, with recoveries taking place in Zone 2. You’ll still sweat plenty, but you likely won’t tire as quickly in an endurance ride. That could make it an excellent starting point for anyone dipping their toes into Power Zone training—and it just might sell you on the idea.
Power Zone Max rides can include any of Zones 1 through 7, but typically focus on Zones 4 through 7. You’ll work through hard-charging intervals with long recoveries in Zone 1.
One common misconception about power zone training is that you’ll PR frequently in the classes. In fact, you won’t PR in most Power Zone classes—and that’s totally okay. In power zone training, it’s more important to maintain the zone the instructor calls out than to push yourself as hard as possible. This includes actually recovering between intervals (which is what often drives your total/average output down).
While your end goal may be to improve your total/average output (and PR in other rides), that doesn’t mean that you should try to achieve this goal in Power Zone rides. Power zone training will help you achieve this goal faster by stressing your body in many different ways that result in you getting stronger more quickly. Sure, you might have the energy to push into Zone 5 when you should be in Zone 4, but that defeats the purpose.
Be patient, listen to the instructor, and relish the challenge of syncing your mind and body. “The different mindset helps as much as the impact on your body,” Peloton instructor Denis Morton says. “You train your brain to focus.”
Why Peloton Instructors Love Power Zones
We caught up with instructors Matt Wilpers and Denis Morton to learn why they’re fans of Peloton Power Zones—and why you’ll love them too.
Matt: As a coach, I get excited when my riders see measurable results (i.e. changes in their performance and/or their body). In my 10+ years of coaching, I have seen the fastest results in my athletes through Power Zone Training. What makes it even better is that I have the creative freedom to make it a fun and engaging experience for everyone.
Denis: The thing I love the most about teaching Power Zones is the freedom we find within the structure. The FTP test levels the playing field, empowering us to compete with ourselves instead of others. After that, as long as we're staying within our prescribed zones, whatever cadence and resistance we use to get there is our choice. As instructors, we make suggestions about cadence and zones, but the rider really gets to make it their own.
Riders can expect a safe, structured workout with clear expectations, objectives, and coaching. At any given moment we know how far along we are, exactly what's expected of us, how long we're holding that intensity and a sound physiological reason behind the workout.
Any reason to take a Power Zone ride is a good one, but I think the most popular reasons would be to customize your workout to your current fitness level and avoid overtraining, to provide yourself with measurable results on your way to your fitness goals, and to give yourself a structured program with transparent methodology to the madness.
Adding Peloton Power Zone Training to Your Routine
Depending on how much time you have and how often you want to ride, your power zone training can vary. Identify your goals and be sure to include a variety of Power Zone class types and durations in your weekly training. The various classes work on different areas of your fitness (especially by training your body to exert more force). And because each one has a different purpose in your training, you’d be doing yourself a disservice by taking only one type of Power Zone training class—so mix it up.


Only got time for one ride per week? In his Power Zone rides, instructor Matt Wilpers often suggests including one Power Zone ride of a longer-than-usual duration each week, between 45-90 minutes, which you can find by filtering for “Power Zone” and “Length” from the touchscreen of your Bike or through the Peloton App.
The Benefits of Power Zone Training Training—Beyond the Bike
No matter how you’re moving, power zone training can help you increase your fitness and teach you how your body responds to various training intensities. It’s all about understanding what your body is capable of, and tailoring your workouts (and your goals) to those abilities. In fact, the benefits of power zone training will impact your fitness capabilities in strength training, cardio, HIIT workouts, running, and more.
How exactly do you gain a better understanding of various training intensities and how your body reacts? In power zone training, you have the opportunity to dial into exactly what it feels like to work in zone 2 vs. zone 5. And while you may not have a color-coded power bar in front of you during, say, an outdoor run, you can still align your goals for the run with your desired intensity. For example, during a 30-minute recovery run, you can aim to keep a pace that feels like working in a zone 2 or low zone 3. In interval runs, meanwhile, you can push to zone 4 for a couple of minutes at a time before lowering into a recovery zone.
This concept applies to non-cardio workouts, too. Want to add an AMRAP finisher to a strength workout? Choose appropriately challenging weights and work at a speed that corresponds to a zone 4 or 5. On the other hand, if your restorative yoga class feels like a Zone 3, something’s amiss.
“There are so many valuable benefits to power zone training, but the most important is a better understanding of how training intensity affects us mentally and physically,” explains Denis. “Time under tension not only shows us how our mind and body respond to training, but also informs the outputs we might aim for in HIIT, Tabata, intervals, or even low impact or music-based rides.”
Why Members Love Peloton Power Zones
“For those feeling nervous about Power Zone Training, please don’t be. It’s all individualized for you which is what makes it so awesome. I love Power Zone Training because it helped get my life and health back, and we have an awesome community of riders who will help you reach your goals whatever they are.”- Jacqui C. / #Le_Chic_JQ
“I am here to say that Power Zone Training is for beginners, as your rapid improvement week to week and month to month will be easy to quantify, see and feel. The beauty of Power Zone Training is that everyone trains at exactly the level that is suited for them (that's why you take the FTP test), so no matter your age, gender, athletic level or output, everyone is doing the same amount of work at every power zone workout. “- Bill L. / #PeloniousMonk
“I am in week 2 of Matt Wilpers' Power Zone Training and I can't believe the changes I can already see! I can hardly wait between rides I am enjoying it so much!" -Connie B. / #PeLoCoCo
“Further evidence of the effectiveness of Power Zone Training: this morning, I ran a 5k for the first time since May, 2008. I ran my fastest 5k in nearly ten years after my previous record with no training apart from my Peloton bike! I'm in (literally) the best shape of my life. I could run circles around my 20-year-old self.” - Alex C. / #AC_SoAero
Get Started with Peloton Power Zones
Ready to try Power Zone Training for yourself? Check out our “Discover Your Power Zones” program. If you’ve dabbled in Peloton Power Zones and want to progress toward a goal, the 5-week “Build Your Power Zones” program is designed to improve your FTP.
Psstt: Follow these instructions below to manually enter and display your Power Zones on your Touchscreen:
On your Touchscreen, click on your username in the lower left corner.
From there, click the red gear symbol in the top left corner, and navigate to the Preferences tab.
Under “Power Zones,” click “Edit Power Zones” and “Custom Value.”
Enter your average output from your 20-minute FTP Test ride, and click “OK.”
Make sure “Display Power Zones” is selected.
Choose a Power Zone class and get started!
This content is for informational and educational purposes only and does not constitute individualized advice. It is not intended to replace professional medical evaluation, diagnosis, or treatment. Seek the advice of your physician for questions you may have regarding your health or a medical condition. If you are having a medical emergency, call your physician or 911 immediately.


Level up your inbox.
Subscribe for a weekly dose of fitness, plus the latest promos, launches, and events.
By providing your email address, you agree to receive marketing communications from Peloton.
For more about how we use your information, see our Privacy Policy.